Profiling Unit Tests in Visual Studio 2008
I had a particular set of tests that when run with a large test data set seemed to be taking a long time to run and so I wanted to check that it was simply the setup and teardown of the tests was taking the time and not the tests itself.
I could have manually put some instrumentation into my tests but I’d rather use a tool for the job and therefore I wanted to run the profiler for my test. It turns out you can do this for MSTest fairly easily. First load the test view (Test –> Windows –> Test View) and seeing as I was using Resharper test runner, this is a fairly important step! Now from the context menu of the test you want to run select ‘Create Performance Session’ :

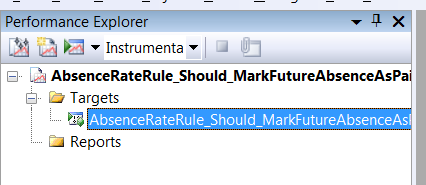
Up pops the Performance Wizard which basically asks whether to Sample or Instrument the process – I chose the later for accuracy. You now have the ‘Performance Explorer’ window with the configured performance profile :
Now all I have to do is click the third button on the toolbar ‘Launch with Profiling’ which runs the process and once completed presents me with a summary of the worst performers :
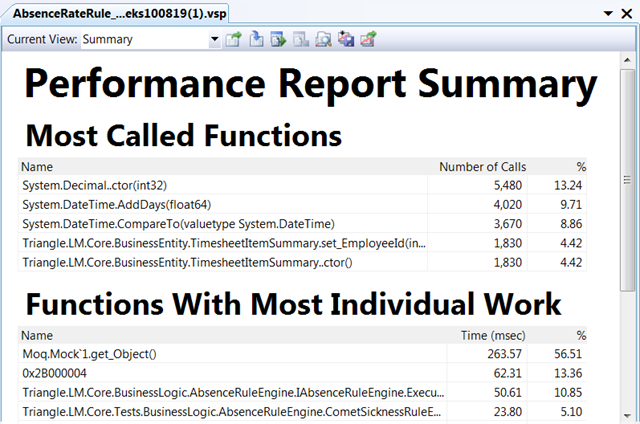
At this point all you have to do is analyse the results and figure out where the slowest sections are. I actually found it easiest to change the view from ‘Summary’ to ‘Modules’ then drill down to the method I new was the method under test and confirm that it was running within an acceptable timescale.
Of course, if you can’t afford Visual Studio Team System then there are other offerings out there… and jetBrains’ dotTrace is one of them which is probably going to cost at lot less!
Post by: Philip Hendry